Knowing your camera's linearity is of utmost importance.
A perfect CCD should behave linearly, the number of counts should double as the exposure times doubles, but in the real CCD world that is not true.
I always tried to expose in order keep counts "inside" the CCD linearity, wich means stay below 36k adu for a KAF1600ME, but in some cases it would be interesting to be allowed to step in to the non-linearty part of the CCD response and be able to still use the data.
…I found it was possible 🙂
Read about it in Buil's website http://www.astrosurf.com/buil/qsi/comparison.htm where he tested two CCD's and gives the equation to use in order correct for non-linearity.
The FLATS Method….
This is a simple way to determine your CCD's linearity, just get some Flats and some Bias.
Well, when we read it it looks quite simple, but in fact to find a stable source for the flats it reveled to be hard.
Tried my Flat's Box but the counts weren't stable for the same exposure, it stayed bumping up on each exposure. Tried to power the box with different sources for the 12v input and also used a 36ah battery, all with the same odd result.
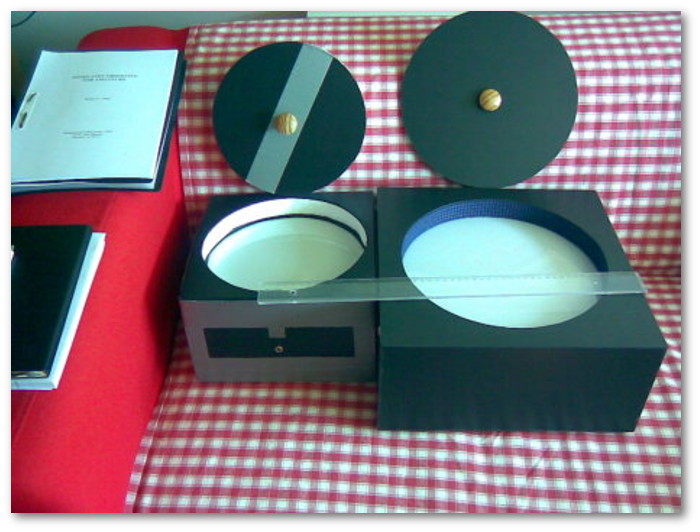
Flat's Boxes
Running out of options I decided to do a test using a flats screen but where could I find one… in my android phone of course.
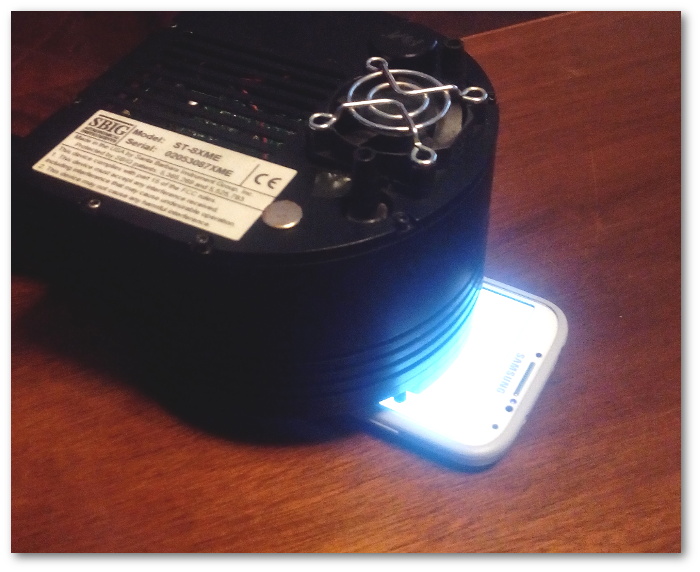
Phone flats technique
Did the test and I was surprised with the constancy of the measurements with the same exposure time, contrasting with the previous results with the light box.
The table below shows 1s exposure.
| # | IMAGE | MODE | MEAN | STDDEV | MIN | MAX |
| 1 | linflat-10xme-031-1_out.fit | 3411 | 3415 | 53.37 | 3206 | 3614 |
| 1 | linflat-10xme-001-1_out.fit | 3403 | 3397 | 53.07 | 3178 | 3615 |
| 1 | linflat-10xme-006-1_out.fit | 3402 | 3402 | 53.14 | 3176 | 3624 |
| 1 | linflat-10xme-011-1_out.fit | 3398 | 3409 | 52.99 | 3173 | 3624 |
| 1 | linflat-10xme-021-1_out.fit | 3409 | 3413 | 53.04 | 3194 | 3627 |
| 1 | linflat-10xme-026-1_out.fit | 3397 | 3410 | 52.99 | 3188 | 3627 |
| 1 | linflat-10xme-016-1_out.fit | 3410 | 3408 | 53.01 | 3195 | 3639 |
Having found the right flat's source I started to do the capture.
Followed these rules:
- Don't use exposures less than 1s if your camera has a shutter, the shutter effect could ruin the experiment completely.
- Make the first exposure 1s have at least 3000 adu, In my case that meant to use blank sheets of 80g paper in between the phone and the camera, I used some 6 or 7 sheets to tune 1s exposure to ~3300 adu.
- Following a tip from a professional astronomer for not doing the obvious sequential 1, 2, 3, 4, 5s…etc exposures I instead scramble the exposure sequence into 1,20,11,3,5,15s…etc.
Processing…
After the sequence was repeated four or five times we have enough data to start the processing.
Processing is simple, just subtract the master bias to all images.
Extracting data…
Decided to use IRAF to extract de statistics from the images as it can easily do it in batch mode.
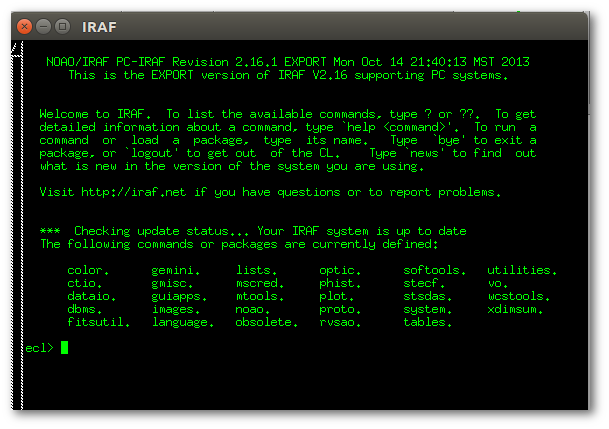
First I cropped the images using a portion of the center image instead of using the whole image of the KAF3200ME 2184x1472px.

To use the batch mode I create a list with all the files

list.txt
linflat-10xme-001-10_out.fit
linflat-10xme-001-11_out.fit
linflat-10xme-001-12_out.fit
linflat-10xme-001-13_out.fit
linflat-10xme-001-14_out.fit
linflat-10xme-001-15_out.fit
linflat-10xme-001-16_out.fit
linflat-10xme-001-17_out.fit
………………
To extract the statistic data from all the croped images I use the IMSTAT command on the files list creating a file with the data at the same time.

data.txt
# IMAGE MODE MEAN STDDEV MIN MAX
linflat-10xme-001-14_out.fit 47304. 47255. 246.4 46154. 48200.
linflat-10xme-006-14_out.fit 47330. 47312. 246.2 46387. 48262.
linflat-10xme-011-14_out.fit 47367. 47343. 246.4 46388. 48238.
linflat-10xme-016-14_out.fit 47351. 47355. 248.8 46202. 48313.
linflat-10xme-021-14_out.fit 47410. 47383. 247. 46283. 48286.
linflat-10xme-026-14_out.fit 47447. 47426. 246.7 46349. 48337.
linflat-10xme-031-14_out.fit 47446. 47440. 248.3 46413. 48437.
…………………..
PLOTTING
Now I have something to plot using my favorite plotting program GNUPLOT
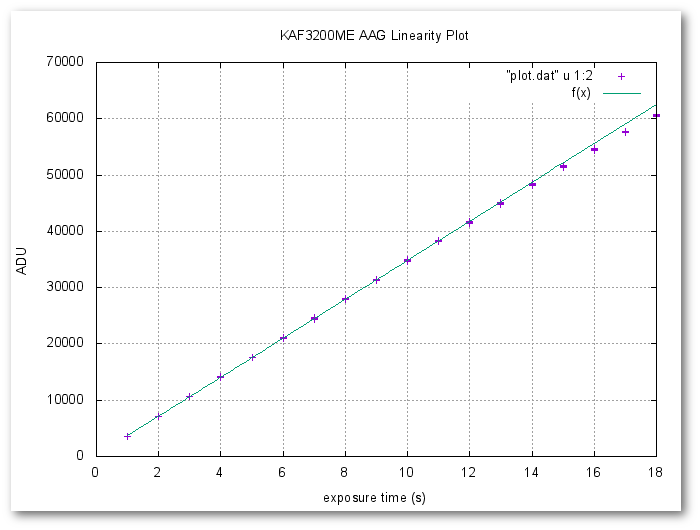
Above is the resulting plot. We can see the data points deviate from the linear slope.
I would say the CCD looks quite linear up to 38000 ADU.
Some of you may not master IRAF and have MaximDL, in that case you can use the INFORMATION dialog setting the MODE to AREA and get the reading of Max, Min and Avg.
Area ( 627, 91 )-( 670, 129 )
Width x Height 44 x 39
Diagonal Size 59
Diagonal Orientation î 228.45° PA N/A
Number of Pixels 1716
Mono
Maximum 1192.000
Minimum 1036.000
Average 1090.581
Std Dev 13.201
I guess you will have to do it by hand on all images and that can be tedious 🙁
Put that data into your favorite spreadsheet and plot it right there with a XYscatter plot, it is easier for those that usualy don't plot with other specific programs.
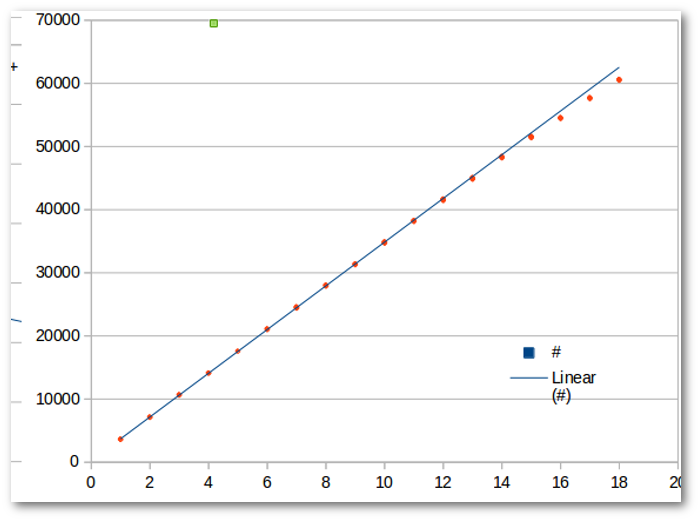
This plot was made with LibreOffice CALC.
Joao